
Climate Vulnerability Analysis
map Descriptions
Check out more information about what each map means down below!
Mapping Table of Contents
SOCIAL
County/City Boundaries
Commissioner Districts
Housing Affordability
Population (Age 19-64, Employed, No Health Insurance)
Transit - Public Bus and Train Routes
ECONOMIC
Food Stores
ENVIRONMENTAL
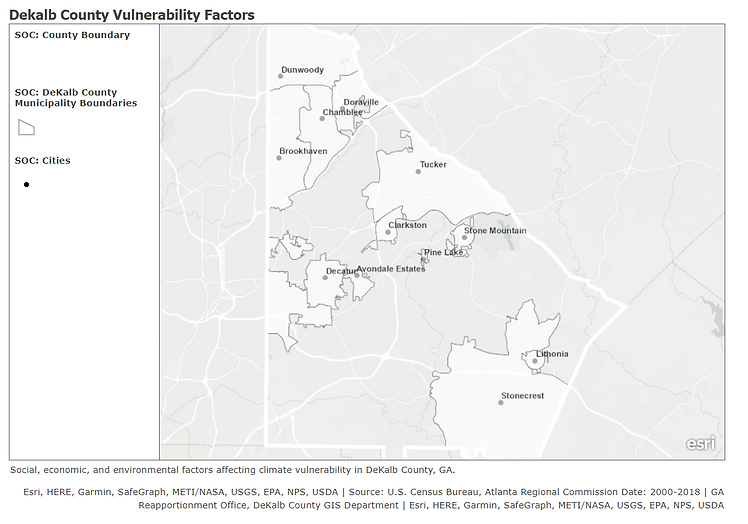
County/City Boundaries
Where did we get the data?
This layer file was developed by the DeKalb County GIS Department for the DeKalb County Department of Planning and Sustainability. The data presented in this file is meant to give the user basic information about the boundaries of municipalities (or cities) within the County.
Why this map matters
We included this map to better understand the spatial relationships between the different data sets and the locations of cities in DeKalb County.
Possible combinations with other Maps
This map was included as a reference material as well as to be overlayed with different data sets to possibly find connections with economic, social, and environmental data.
Commissioner Districts

Where did we get the data?
This layer file was developed by the DeKalb County GIS Department for the DeKalb County Department of Planning and Sustainability. The data presented in this file is meant to give the user basic information about the boundaries of municipalities (or cities) within the County.
Why this map matters
We included this map to better understand the spatial relationships between the different data sets and the locations of cities in DeKalb County. The map does not include districts six and seven, which are two super districts that divide the county in half from east to west.
Possible combinations with other Maps
This map was included as a reference material as well as to be overlayed with different data sets to possibly find connections with economic, social, and environmental data.
Total Businesses

Where did we get the data?
This data is sourced from the U.S. Census Bureau and was translated into usable map layers by Esri (Company that created and owns ArcGIS) (US Census Bureau, 2018).
What it Shows/The implications
There are a larger number of businesses near cities in the county. The highest number are located in Chamblee and Tucker, which can be seen in the darker shading, with over 2100 businesses. There are also a large number with over 1300 businesses in cities including Doraville, Decatur, Stone Mountain and Pine Lake which can be seen in the next lightest shading. There are fewer businesses with above 700 in the western and southern parts of the county including the cities of Dunwoody, Brookhaven, Lithonia and Stonecrest. The lowest number of businesses are in Avondale Estates and other central areas of the county.
Why this map matters
This map helps to illustrate where there are more businesses available in the county. Areas of high concentration offer more opportunities for employment. The areas that are further away from cities, typically have less access to businesses.
Possible combinations with other Maps
This map can be combined with other maps including poverty and unemployment to see where the businesses are located in the county compared to social factors.
Total Business Sales

Where did we get the data?
This data is sourced from the U.S. Census Bureau and was translated into usable map layers by Esri (Company that created and owns ArcGIS) (US Census Bureau, 2018).
What it Shows/The implications
There are the highest business sales in the northern parts of the county in cities including Tucker, Doraville, and Chamblee. The middle range of business sales in the county can be seen in cities including Dunwoody, Brookhaven, Stone Mountain, Pine Lake, and Lithonia. The lowest sales can geographically be seen in the central and southern regions of the county in the cities of Stonecrest, Decatur, and Avondale Estates.
Why this map matters
This map highlights that the northern part of the county receives more sales and money from businesses compared to the southern part.
Possible combinations with other Map
There can be combinations with the business sales map and other maps including vehicle access, poverty, insurance, income, and housing affordability.
Movie/Amusement Businesses

Where did we get the data?
This data is sourced from the U.S. Census Bureau and was translated into usable map layers by Esri (Company that created and owns ArcGIS) (US Census Bureau, 2018).
What it Shows/The implications
This map shows the number of movie and amusement businesses located in the county. There are the largest number of them located near the cities of Decatur, Tucker and Chamblee each having over 66 businesses. There are over 23 businesses in the cities of Brookhaven, Stone Mountain, Pine Lake, and Lithonia. There remaining parts of the county have less than 22 businesses and these are primarily located in the central and southern parts of the county.
Why this map matters
This map shows the concentration of movie and film businesses which is a large industry in the county. There has been a large increase in the film industry in the county which has brought in money to the county.
Possible combinations with other Map
This can be combined with other maps including income and unemployment maps.
Health Service Sales

Where did we get the data?
This data is sourced from the U.S. Census Bureau and was translated into usable map layers by Esri (Company that created and owns ArcGIS) (US Census Bureau, 2018).
What it Shows/The implications
This map shows the sales from health services throughout the county. The areas with the highest sales are located near the center of the county, where many of the Emory hospital locations are located. There are less sales from hospitals in the central and southern regions of the county.
Why this map matters
This map shows the importance of large hospitals and health care businesses in the county, including Emory. These help to provide services and employment to people in DeKalb county.
Possible combinations with other Map
This map can be combined with other social maps including income, poverty, unemployment, as well as vehicle accessibility.
Education/ Library Businesses

Where did we get the data?
This data is sourced from the U.S. Census Bureau and was translated into usable map layers by Esri (Company that created and owns ArcGIS) (US Census Bureau, 2018).
What it Shows/The implications
This map shows the number of education and library businesses in the county. There are over 75 businesses in areas near Dunwoody and Decatur. There are over 20 in Brookhaven, Chamblee, Doraville, Tucker, Stone Mountain, Pine Lake, Lithonia, and Stonecrest. There are less educational businesses in unincorporated areas near the center and south regions of the county.
Why this map matters
This map shows the distribution of educational businesses throughout the county. There are more located toward the north and central areas of the county near cities. This is due to the large number of educational institutions in the county.
Possible combinations with other Map
There can be combinations with vehicle accessibility, and transit to see how people are able to access these locations.
Food Stores

Where did we get the data?
This data is sourced from the U.S. Census Bureau and was translated into usable map layers by Esri (Company that created and owns ArcGIS) (US Census Bureau, 2018).
What it Shows/The implications
This map shows the number of food store businesses throughout the county. The areas with the largest number having over 48 include the areas near Chamblee and Tucker. The next largest with over 33 include regions near the cities of Doraville, Stone Mountain, and Pine Lake. The next largest with over 20 food stores include near the cities of Lithonia, Decatur, and Dunwoody. The areas with less than 20 include Avondale Estates, Brookhaven, Stonecrest and other southern and central unincorporated regions of the county.
Why this map matters
This map is important to see where food stores are located in the county. This can help determine how food desert problems can be addressed in the county and where there can be additional grocery stores and farmers markets located in the county.
Possible combinations with other Map
This map can be combined with the food desert maps as well as with income and vehicle accessibility maps.
Housing Affordability

Where did we get the data?
The layers used in this map were developed by the Research & Analytics Group of the Atlanta Regional Commission to show comparison of housing ownership costs and rental costs to income by the 2018 Dekalb Sustainable Neighborhood Initiative in the Atlanta region (DeKalb Sustainable Neighborhood Initiative, 2018).
What it Shows/The implications
This housing affordability map shows the areas in the county based on the number of all occupied units for which cost exceeds 30% of income. The areas with the largest number of units includes the region around Avondale Estates. Other parts of the county with over 5800 units where the cost is over 30% of income include Stonecrest, Lithonia, and unincorporated parts of the county along I-85. There are over 4600 units in other cities including Brookhaven, Chamblee, Doraville, Dunwoody, Stone Mountain, and Pine Lake. Other areas with less than 4600 units include Tucker, and other central and easter unincorporated parts of the county.
Why this map matters
This map helps to understand housing affordability in DeKalb County. It shows the number of units in different regions where the cost exceeds 30% of income.
Possible combinations with other Maps
The housing affordability map can be combined with other maps including income, poverty, unemployment, and business number and sales.
Per capita Income

Where did we get the data?
The layers used in this map were developed by the Research & Analytics Group of the Atlanta Regional Commission to show comparison of housing ownership costs and rental costs to income by the 2018 Dekalb Sustainable Neighborhood Initiative in the Atlanta region (DeKalb Sustainable Neighborhood Initiative, 2018).
What it Shows/ The implications
This map shows the per capita income from 2018. The areas with the highest income category with over $36,710 are in the northern regions of the county including the cities of Dunwoody, Brookhaven, Chamblee, and Doraville. The second largest category with per capita income over $28,192 include Tucker and other northeastern parts of the county. Areas with over $23,699 include along I-85 and southern parts of the county. Much of the southeastern part of the county is in the next category with income above $20,512. The lowest per capita income range, with income over $17,868, is seen in much of the central regions in the county and includes Pine Lake and Stone Mountain.
Why this map matters
This map helps to understand the income and how it varies throughout the county.
Possible combinations with other Maps
Pairing this map with other factors including transit access, vehicle accessibility, poverty, and housing affordability, and food deserts can help to understand socio-economic trends in the county.
Population age 19-64 employed, no health insurance

Where did we get the data?
The layers used in this map were developed by the Research & Analytics Group of the Atlanta Regional Commission to show comparison of housing ownership costs and rental costs to income by the 2018 Dekalb Sustainable Neighborhood Initiative in the Atlanta region (DeKalb Sustainable Neighborhood Initiative, 2018).
What it Show/The implications
This map shows the percentage of the population, aged 19-64 that are employed yet have no health insurance coverage. The map shows that around the northern and western most parts of the county, the percentage of uninsured individuals does not surpass 10.2%. Whereas in southern and eastern most parts of the county, the percentage of uninsured is predominantly greater than 10.2%.
Why this map matters
This map is important because it may indicate that people who are uninsured suffer from financial instability. Meaning, they may not have the funds to provide full coverage to their families, or they may not have a job that provides them with health benefits. Without health insurance coverage, these residents run the risk of getting even more sick because they are unable to and may even be afraid of seeking professional help because of high medical bills, etc.
Possible combinations with other Maps
Pairing this map with other maps such as poverty, and percent unemployed can help to understand socio-economic trends in the county.
Population in Poverty (%)

Where did we get the data?
The layers used in this map were developed by the Research & Analytics Group of the Atlanta Regional Commission to show comparison of housing ownership costs and rental costs to income by the 2018 Dekalb Sustainable Neighborhood Initiative in the Atlanta region (DeKalb Sustainable Neighborhood Initiative, 2018).
What it Shows/The implications
This map shows the population that is in poverty as of 2018 with the darkest region indicating a higher percentage being below poverty and the lighter region indicating a lower percentage of poverty. The percentages range from 8.5% to 29.7%.
Why this map matters
This map is representative of the low income communities who are the most susceptible to socio-economic challenges that climate change poses in DeKalb county. People below the poverty line suffer from the inability to meet the basic needs of shelter, food, proper sanitation, education, and healthcare. Therefore, it is important where the regions of most poverty are so that the county can better allocate funds and resources such as clinics, schools, grocery stores, libraries etc.
Possible combinations with other Maps
It would be interesting to combine this map along with a food desert map to see how accessible grocery stores are to the areas of highest poverty. Also, we could combine this map with a map of food stamps where we might note a similar trend. Finally, by combining the poverty map with a public transportation map, we may be able to see why businesses are not accessible to impoverished areas.
Vehicle Accessibility (%)

Where did we get the data?
The layers used in this map were developed by the Research & Analytics Group of the Atlanta Regional Commission to show comparison of housing ownership costs and rental costs to income by the 2018 Dekalb Sustainable Neighborhood Initiative in the Atlanta region (DeKalb Sustainable Neighborhood Initiative, 2018).
What it Shows/The implications
This map shows the number of housing units that have no vehicles. The darker shaded areas show that there is a greater number of households with no vehicles whereas the lighter areas indicate a low number of households with no vehicles. The common trend seen here is that in the areas where there is accessibility to public transportation, there are more homes that have no vehicle. On the other hand, in lighter shaded regions where there are more vehicle owners, we see little to no access to public transportation.
Why this map matters
This map matters because it gives us insight on the community's access to public facilities. When looking at households with no vehicles that are farther away from public transit, we can assume it is more difficult for them to access the community's assets.
Possible combinations with other Maps
This map can be combined with other maps including public transportation and food deserts to see where the bus/ rail systems are located in the county compared to vehicle owners. Also, it would be interesting to see how far away grocery stores are in lighter shaded areas where there are high numbers of vehicle owners.
Civilian Unemployment (%)

Food Deserts
Where did we get the data?
The layers used in this map were developed by the Research & Analytics Group of the Atlanta Regional Commission to show comparison of housing ownership costs and rental costs to income by the 2018 Dekalb Sustainable Neighborhood Initiative in the Atlanta region (DeKalb Sustainable Neighborhood Initiative, 2018).
What it Shows/The implications
This map illustrates the area of unemployment with the darker regions highlighting a greater percentage of people unemployed. The civilian unemployment percentages range from: 1.8 to 8.5%. The areas with the highest percentages of unemployment include near the southern and southeastern parts of the county. The lowest unemployment percentages are toward the north of the county.
Why this map matters
This map matters because it can show the areas that are the most vulnerable to socio-economic challenges. In addition, this map can show investors which areas they should invest in, and start up businesses. In this way, those that are unemployed can have the opportunity to get a job at a close proximity to their home.
Possible combinations with other Maps
This map can be combined with other maps including poverty and food deserts to see where the businesses are located in the county compared to social factors.

Where did we get the data?
We got this data from the USDA Food Access Research Atlas. This data shows the 2015 values for food access throughout the county including different low income, low access data assessments (USDA, 2015).
What it Shows/The implications
This map looks into food deserts by showing where there are areas in the county that are more than 1 mile from a food store. Areas in blue are considered to be low income, low access (LILA) areas more than 1 mile from a food store.The areas that are more than 1 mile from a grocery store are near the central and southern regions of the county including near the cities of Clarkston, Avondale Estates, and Lithonia.
Why this map matters
This map helps to determine the areas that could have better access to a grocery store or farmers market.
Possible combinations with other Maps
When combining this map with others including food stores, incomes, and vehicle access, there can be a better understanding of food access in the county and how to be able to prioritize new store and farming locations.
Food Stamps

Transit (MARTA) - Public Bus and Train Routes

Where did we get the data?
This data is sourced from the Metropolitan Atlanta Rapid Transit Authority (MARTA) and was translated into usable map layers by Esri (Company that created and owns ArcGIS) (MARTA Public Bus and Train Route Data, 2017).
What it Shows/The implications
This map shows the MARTA rail system routes that run up to Doraville and east to Indian Creek in bold black lines. This map shows all the MARTA rail bus routes that run through the county in black lines. It is worth noting that only two of the four MARTA rail lines enter DeKalb and the furthest they reach is Doraville and Indian Creek. The rail system does not reach further south or east of Indian Creek, thus leaving a big portion of the county without access to a public rail system.
Why this map matters
This map helps highlight what areas MARTA should expand in.
Possible combinations with other Maps
If paired with a business sales map, it could help identify which major profit areas could use the accessibility of MARTA rail systems. Also, pairing this map with a vehicle accessibility map would also help identify which individuals need access to public transportation.
Transit (MARTA)- Public Bus Stops

Bus Stops
Where did we get the data?
This data is sourced from the Metropolitan Atlanta Rapid Transit Authority (MARTA) and was translated into usable map layers by Esri (Company that created and owns ArcGIS) (MARTA Public Bus and Train Route Data, 2017).
What it Shows/The implications
This map indicates the locations of MARTA bus stops with yellow dots. This map shows the MARTA bus stops all throughout the county of DeKalb in yellow dots. It is important to note how the bus stops are more heavily concentrated in the middle-west areas of the county and least concentrated going towards the east or south parts of the county.
Why this map matters
This map is important because it is a representation of the accessibility that residents of DeKalb county have to public transportation.
Possible combinations with other Maps
This map could be paired with a vehicle access and unemployment map to see what areas need the most access to public transportation.
Respiratory Disease

Where did we get the data?
This data is sourced from the Online Analytical Statistical Information System (OASIS) Mortality Mapping Tool from the Georgia Department of Public Health (OASIS, 2021).
What it Shows/The implications
This is a map of the number of deaths by census tract in DeKalb county for respiratory diseases including flu, pneumonia, bronchitis, emphysema, and asthma.The higher ranked areas are toward the south of the county as well as some large clusters toward the east and central regions of the county. For the most part, there is an equal spread in the number of respiratory disease deaths with many of the tracts having between 5 and 22 deaths.
Why this map matters
Respiratory diseases are caused by infections from different forms of air pollution. The disease includes lung cancer, asthma, pulmonary fibrosis, chronic obstructive pulmonary disease, and pneumonia. The diseases can be caused from tobacco, asbestos, radon, and other types of pollution. This information can be used along with other health maps to see if there are trends in tract areas with high numbers in more than one disease.
Possible combinations with other Maps
By layering and comparing it with other factors including income, transit, and environmental layers there can be a better understanding of areas impacted the most from breathing related conditions.
Cardiovascular Disease

Diabetes

Cancer

Flooding

Where did we get the data?
The map data comes from the ARC, Atlanta Regional Commission, who sourced the information from FEMA maps, including the Flood Insurance Rates Map (Atlanta Regional Commission, 2020). This data is the floodplains throughout DeKalb County.
What it Shows/The implications
This map guides the county in discovering which residents are at risk of having their homes or businesses flood. This is important to protect those residents, their safety, and their belongings. Additionally this helps the county develop policy and infrastructure for these floodplains.
Why this map matters
This map shows the homes and other buildings at risk of flooding due to a weather event throughout the county. Using the knowledge of where floodplains exist, green infrastructure can be thoughtfully placed in necessary locations, houses can be removed through the FEMA Home Buyout plan, and homeowners can buy flood insurance based off of their risk.
Possible combinations with other Maps
This map can be combined with maps of Poverty and Per Capita Income to determine if the population of DeKalb in poverty is directly impacted by floods.
Urban Heat Island

Where did we get the data?
The map data comes from The Trust for Public Land who derived the 30 meter raster from the Landsat 8 imagery band (ArcGIS, 2019a). The data was taken from ground-level thermal sensors for the summers of 2018 and 2019.
What it Shows/The implications
The map shows the areas most at risk for weather related deaths and places that trap heat. This is important for cities to monitor so they can prevent the further buildup of heat and monitor areas with no existing buildup to maintain them.
Why this map matters
The map shows places where steps must be taken to reduce urban heat to protect the residents within these cities. This also shows areas to monitor for increased heat-related deaths and places to add shelters for people to cool down in.
Possible combinations with other Maps
This map can be combined with the Health Insurance map and the Unemployment Map to determine areas at highest risk of suffering health problems due to the increased heat. Unemployment specifically due to potential lack of money to pay for air conditioning and health insurance because of the barriers to receiving potential life-saving treatment.
Tree Canopy

Where did we get the data?
This map was created by the U.S. Forest Service to provide relevant information to the U.S. about the tree canopy (ArcGIS, 2019b). The Multi-Resolution Land Characteristics Consortium created the National Land Cover Database 2016 percent tree canopy cover from which this data was sourced (ArcGIS, 2019b).
What it Shows/The implications
Tree Canopy is important for many environmental effects in a city, such as controlling stormwater and reducing the heat island effect. This also highlights areas with higher potential for effects related to not having a tree canopy, such as greater flooding.
Why this map matters
This map can help counties take action to protect their environments by determining areas most in need of support. Knowing the tree canopy in a city can propel a city into action to increase the cover, protect the cover, or take other important action.
Possible combinations with other Maps
This map can be combined with floodplain to determine areas in need of green infrastructure. It can also be combined with the Heat Island Effect map and the poverty map to determine areas more at risk of heat related deaths and other health issues.
Total Energy Consumption (MWh per year)

Where did we get the data?
This map was created by Lauren Riehm using data processed by Brooke Bergstrom and Juliette Goff. The energy consumption data was provided by L. Diez who received the data from Georgia Power (L. Diez, 2021).
What it Shows/The implications
The implications of the map are which areas draw the most power and is this power able to be sourced from sustainable sources. Using this map, DeKalb can manage their energy usage.
Why this map matters
The energy consumption is important to know in order to determine sustainable sources to draw power from. Based on needed electricity, determined by the consumption of an area, and the environment present, a sustainable choice can be made to generate electricity from.
Possible combinations with other Maps
This map can be combined with the Surplus Solar Energy Map to determine efficiency of solar energy sources for the county, and with businesses to determine the energy draw of businesses in the county.
Surplus Solar Energy after Energy Consumption (MWh per year)

Where did we get the data?
The solar energy potential in DeKalb county was pulled from the Google Sunroof project (Google, n.d.). With this energy, B. Bergstrom and J. Goff calculated the surplus solar energy after the energy consumption by the DeKalb county area. This map is created by Lauren Riehm and shows surplus across the county.
What it Shows/The implications
This map shows how effective using solar energy for DeKalb’s energy source could be by showing how much energy will be left over if solar energy is maximized. This information is important to consider when determining sustainable energy sources for DeKalb County.
Why this map matters
Showing how solar energy could power the county is important for determining a sustainable energy source and then convincing the population to switch to this energy source. This map is also helpful to see the potential of solar power across the county.
Possible combinations with other Maps
This map can be combined with the Total Energy Consumption map and the Per Capita Income map to determine which income brackets are using the most energy and have the most surplus after usage.
Where did we get the data?
We got this data from the Atlanta Regional Commission from their layer from the Georgia Department of Human Services analysing public assistance and individuals receiving Supplemental Nutrition Assistance Programs (SNAP) (Georgia Department of Human Services, 2015).
What it Shows/The implications
This map shows the number of individuals receiving food stamps in the county as of 2013. The lighter coloring indicates a smaller number while the darker color indicates a larger number. This map shows the 2013 numbers for individuals receiving food stamps in the county. The light coloring indicates a smaller value with less than 685 individuals receiving food stamps. The darker range of colors indicates values over 685. The darker shaded regions are located in the southern parts of the county. The lighter color is represented more in the northern part of the county.
Why this map matters
This map distinguishes areas that include people that receive more on food stamps compared to areas that receive less food stamps.
Possible combinations with other Maps
When combining this map with others including food access, transit, and food stores, there can be a better understanding of the geographical areas in the county that could receive more healthy food stores, gardens, or markets.
Where did we get the data?
This data is sourced from the Online Analytical Statistical Information System (OASIS) Mortality Mapping Tool from the Georgia Department of Public Health (OASIS, 2021).
What it Shows/The implications
This is a map of the number of deaths by census tract in DeKalb county for different types of cancers.The higher ranked areas can be found in the southernmost regions, particularly in the southeastern part of the county. This area has between 70 and 97 deaths from cancers. There are also many areas within the 45-68 range in much of the central region of the county.
Why this map matters
The cancers assessed include oral cancer, throat cancer, leukemia, brain cancer, testicular cancer, bladder cancer, prostate cancer, bladder cancer, kidney cancer, ovarian cancer, uterine cancer, skin cancer, breast cancer, cervical cancer, pancreatic cancer, cervical cancer, liver cancer, lung cancer, and stomach cancer. This map shows the deaths by census tract of all types of cancer in the county.
Possible combinations with other Maps
By analyzing it with other health related maps, income, vehicle access, and environmental maps there can be a better understanding of if there are areas that are affected the most and could use additional services and resources.
Where did we get the data?
This data is sourced from the Online Analytical Statistical Information System (OASIS) Mortality Mapping Tool from the Georgia Department of Public Health (OASIS, 2021).
What it Shows/The implications
This is a map of deaths from major cardiovascular diseases by census tract in DeKalb county from the years of 2015 through 2019. The areas with higher death rates are primarily in the southern regions of the county as well as the eastern regions.
Why this map matters
Cardiovascular diseases are a group of disorders that affect the heart. Some of them include rheumatic heart disease, coronary heart disease and cerebrovascular disease. Many of the deaths associated with cardiovascular disease are from heart attacks and strokes.This map highlights the tracts in the county that have a larger number of deaths from cardiovascular disease.
Possible combinations with other Maps
This information can be analyzed with food access, transit, and hospitals to see if there are adequate services nearby in areas where there are a large number of health related deaths.
Where did we get the data?
This data is sourced from the Online Analytical Statistical Information System (OASIS) Mortality Mapping Tool from the Georgia Department of Public Health (OASIS, 2021).
What it Shows/The implications
This is a map of the number of diabetes related deaths in DeKalb county. The higher ranked areas are toward the south of the county, specifically the Southeast corner with a few scattered high cases in the southwest areas. Overall, this map is illustrating a scattered trend of diabetes-related deaths throughout the county with the darker shades showing more deaths by diabetes. However, the higher ranked areas are toward the south of the county, specifically the Southeast corner with a few scattered high cases in the southwest areas.
Possible combinations with other Maps
This map could be paired with other health risk maps that could potentially help identify the areas of the highest morbidity. For instance, comparing this map to a map of cancers or to a map of cardiovascular diseases.